Ulta | Streamlining Processes to Meet Consumers Where They Are

In the beauty industry, and retail in general, consumer behaviors and insights are a swinging pendulum. Whether it’s a new skincare trend inspired by a viral TikTok, or say, an international pandemic that causes a decrease in makeup-wearing, many factors contribute to constant changes in consumer wants and needs for Ulta Beauty. Find out how […]
Trusted Media Brands’ Journey to Constant Customer Connection

Learn about Trusted Media Brands’ partnership with Fuel Cycle and its journey to finding more constant customer connection with their insights.
Fuel Cycle Unveils New Website as Part of Company Rebrand
Market research cloud leader announces new website as it continues to ignite action through insights SANTA MONICA, Calif. – June 21, 2022 – Fuel Cycle Inc., the leading market research cloud for Fortune 500 companies, today announced the launch of its new website. Featuring a new user interface, improved functionality and added features, the new […]
GreenBook Tech Showcase: Communities

Hear directly from SallyPage McKinney, Product Manager at Fuel Cycle about our community platform. In this session, you’ll learn how companies can leverage online communities to connect their customers and employees.
Democratization Of Research

There’s no “i” in team, and there’s certainly no “i” in research. Market research (MR) isn’t a one-person job, and it shouldn’t be a one-department job either. The democratization of research focuses on empowering cross-departmental teams within an organization to conduct their own research, analyze the results, and make relevant decisions. Although research democratization may […]
How To Best Use Qual In A Community Setting

If you’ve ever been in a focus group, agreed to be an in-home product tester, or answered questions about a brand’s products or services during a one-on-one interview, you’ve participated in qualitative (qual) market research. Qualitative market research studies customers’ behaviors, motivations, and opinions about a specific product or service. Qual research is primarily conducted […]
The Importance of Environmental, Corporate, & Social Sustainability

In 2022, the success of a business goes far beyond its profitability. Today’s customers expect more from the brand they purchase from; they expect that corporations are not faceless enterprises hell-bent on making a dollar; they want to know that companies are stewards of their communities and, more importantly, of planet earth. 77% of consumers […]
The Media Insights & Engagement Conference 2022

Sponsor | Nashville, TN
Plant-Based Food Trends To Watch
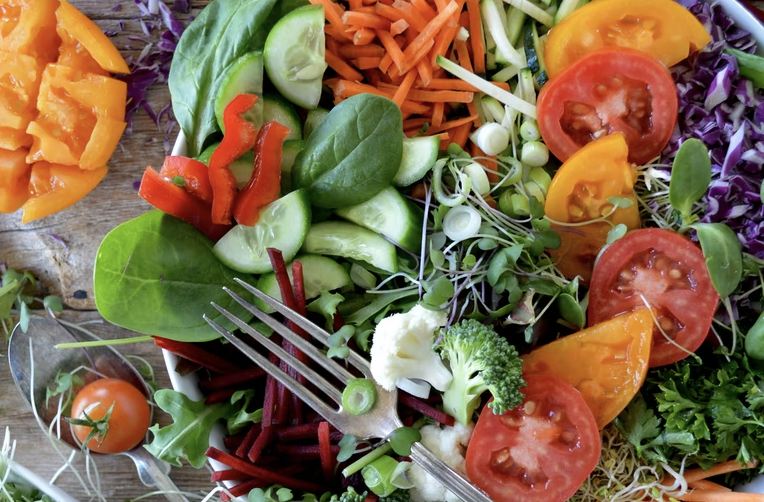
Have you ever seen a vegan with a bucket of Kentucky Fried Chicken? It may become a regular sighting, given the fast-food chain announced its new menu item, Beyond Chicken, in January. “The mission from day one was simple – make the world-famous Kentucky Fried Chicken from plants,” said Kevin Hochman, president of KFC U.S., […]
The Great Consumer Shift: Store Brand vs. Name Brand

Many things have changed over the past two and a half years. First, the pandemic impacted people and businesses, especially in spending behavior. A challenging economic situation and job cuts meant consumers became more conscious about where and on what they spend their money. We’ve seen a pivot to buying more store-brand retail and consumer […]