
In the search for insights, analyzing data with speed and accuracy has always been paramount. Researchers mine through multiple waves of data coming from multiple channels, trying to quickly pinpoint significant findings that will drive either their own or their client’s businesses, forward. In doing so, there are a number of challenges that are consistently being faced.
- Data analysis takes too much time
- Data analysis requires statistics expertise
- Keeping data accurate and up-to-date across platforms is difficult
- Additional tools are needed for data visualization and secure sharing
To further support the research needs of Fuel Cycle clients, we’re proud to announce the launch of FC Analytics. This solution, which complements our platform with advanced analytics and rich data visualization tools, is fully integrated with the Fuel Cycle platform via freshly-developed APIs. Partnering with MarketSight to create FC Analytics allowed our teams to quickly co-develop an integrated analysis and visualization solution.
FC Analytics provides many overarching benefits that address those challenges faced in the analytics space. In FC Analytics:
- Data analysis is done quickly in a UI that points you to significant findings.
- Regressions, correlations, and R-scripts can all be run with ease, turning even the most junior researcher into an analytics all-star.
- Your data is now synced with your analyses and deliverables, minimizing the risk of data inaccuracy, and laborious data transfers.
- Your data collection, analysis, visualization, and sharing functionality now has one home in Fuel Cycle, meaning the latest survey results can be illustrated in dynamic outputs like charts and dashboards, automatically.
Why we partnered with MarketSight
Insights professionals working on various types of projects have various needs. Our goal for this new offering was to provide access to tools which cover additional stages of the research process to produce a more wholesome platform.
How it Works
Once you have your data, you can sync it to FC Analytics. The two systems work as a single platform to maintain data accuracy, and reduce complexities in moving from tool to tool. Here’s a brief outline of what’s available to you in FC Analytics.
Analytics
Simple-to-use drag and drop crosstabs automatically apply stats tests to your selected variables to help you quickly pinpoint new insights.
Also available:
- Custom variable creation
- Advanced analytics
- Built-in R packages
Visualization
Choose from many different dashboard templates that are optimized for different devices and create your very own reporting masterpiece that’s fed by live data.
Also available:
- Free-form dashboard designer
- Word clouds to display qualitative data
- Dozens of chart types that sync directly with PowerPoint
Sharing
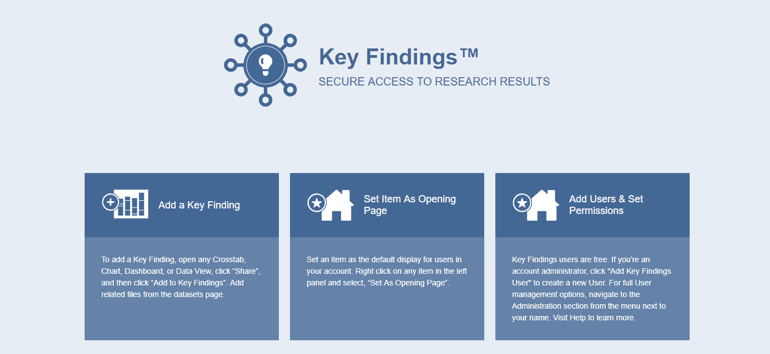
The Key Findings sharing portal lets you consolidate FC Analytics items such as crosstabs, charts, dashboards and more, including all your relevant project files. Create unique, password-protected folders for clients or team members to provide easy access to your research data when needed.
Also available:
- Collaborate on the same dataset with colleagues, without interruptions
- Email a link directly to the crosstab, chart, or other item you’d like to share
- Provide a client with a free “read-only” license
Common Uses
FC Analytics can tackle a variety of research projects, especially long-term studies.
Customer Experience
Unify your crosstabs and charts into an illustrative dashboard and monitor improvements in customer experience metrics with each new initiative.
Product Development
Analyze mountains of data with the help of automated functions to determine precisely how to build the next big product for your organization.
Brand Awareness
Segment your data with unique variables and customizable filters to understand which demographics are becoming more familiar with your brand.
In Conclusion
Data collection technologies have improved rapidly over the last several years as researchers increase the number of channels they collect data through, and our customers press us to help them deliver results, faster. Progress will come from how well solution providers can empower researchers to collect and analyze larger, more complex types of data, and rapidly provide insights to make decisions in markets that continue to change at exponential rates. With periodic updates to FC Analytics, always available to you through its cloud-based hosting, we continue to address the changing and growing demands of researchers to help them make better business decisions as efficiently as possible.
To learn more about FC Analytics, click here.