
It’s no secret that in order to get the most out of market research, you’ll want to make sure you gather the data most reflective of your target audience.
The simple and easiest way to do this is to ensure your sample is large enough to provide accurate insight. And luckily for you, there is one standard formula for doing just this!
What is a ‘Sample’?
Just like a grocery store sample gives a taste test of the actual product, a sample in regards to surveys is a test group that represents your target audience.
Here’s where the comparison really sticks. A grocery store sample should taste like, look like, and completely reflect the actual product for purchasing, right? A survey sample should do the absolute same. It should be a pinpoint accurate reflection of the audience- enough to make key decisions, strategize, or implement organizational projects and campaigns.
In order to do this, you have to have the right sample size.
What Makes a Good Sample Size
Determining a good sample size includes four key considerations you should make right off the bat.
The Size of The Population
Not the general population, but the population of your target audience as a whole. For example, if you’re targeting wealthy, middle-aged individuals, you’ll want to cross-reference these factors and get a good idea of scope. It doesn’t have to be exact, but you should have a pretty good idea about how big your audience is.
Margin of Error
This is basically the lee-way you give your sample. Since not all samples will be dead-center, your margin of error will indicate how much higher or lower your sample mean is in regards to the actual mean of the population. For example, “58% of people agreed with statement Z, with a +/- 4% margin of error.”
Your Level of Confidence
This is exactly what it sounds like. Your “Confidence Level” just indicates how confident you are that the actual mean falls within your margin of error. You’ll see confidence levels of 90%, 95%, and 99% most often.
Standard Deviation
That term likely brought you right back to high school math, but in regards to samples, it’s the variance that you expect in your responses. You won’t necessarily know this yet (because you haven’t given the survey yet) but a safe bet is .5 as it will help calculate a large enough sample size.
Once you have these four determinants, you can use them to calculate your sample size.
Calculating Your Sample Size
Calculating your sample size involves using the information you gathered to determine how large your sample should be to reflect your population.
1. Convert your confidence level to a Z score. This step has to be done because there must be a constant. Here’s a handy conversion guide for the most common confidence levels:
- 90% – Z Score = 1.645
- 95% – Z Score = 1.96
- 99% – Z Score = 2.576
2. Now, plug your Z score, standard deviation, and confidence interval into this formula:
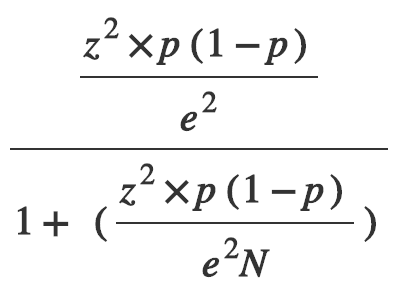
3. Or, because we’re in the modern age of technology, you can use an online sample size calculator. Simply plug in your determinants and with a little magic sauce, it’ll calculate it for you.
Congratulations! You have now determined how many respondents your sample should have!